

The best metrics to measure the success of your Facebook page
You’re a business that has deep-dived into building a presence on Facebook. You’ve been at it for many months, posting various content, but you’re at a crossroads. Is this working?
Am I winning? Are people engaging with my content? Has the effort been worth it? Do I see a spike in website traffic due to my social media efforts?
I could bet you a big wager. These are just a few questions you’re likely asking yourself if you don’t yet have a good handle on your Facebook performance. For this reason alone, you need to get to know your analytics…
We’re talking about Facebook metrics.
But there are loads! You say. I don’t understand what all these graphs mean. It’s true that with Facebook metrics, you can descend into a rabbit hole of stats, making you feel a little disorientated. Still, this blog will share with you the best Facebook page and post metrics to get a better understanding of your efforts and identify which posts generate the most engagement for your brand.
In this blog, we discuss the best Facebook metrics to look at for:
Facebook Page and Post Metrics
Facebook Brand Awareness
Facebook Video Analytics
Facebook Ad Metrics
So let’s start looking at the best metrics to consider when measuring the performance and success of your Facebook Page and posts.
Facebook Page Likes and Follows
Getting a page like on Facebook is the holy grail of all metrics. It means someone likes your brand that much they want to follow you and get all your good stuff in their newsfeed. Understanding yourpage’s like metrics help you to gauge how interested the community is in your brand.
You’ll find your page’s like metrics in Facebook Insights overview tab and audience section.
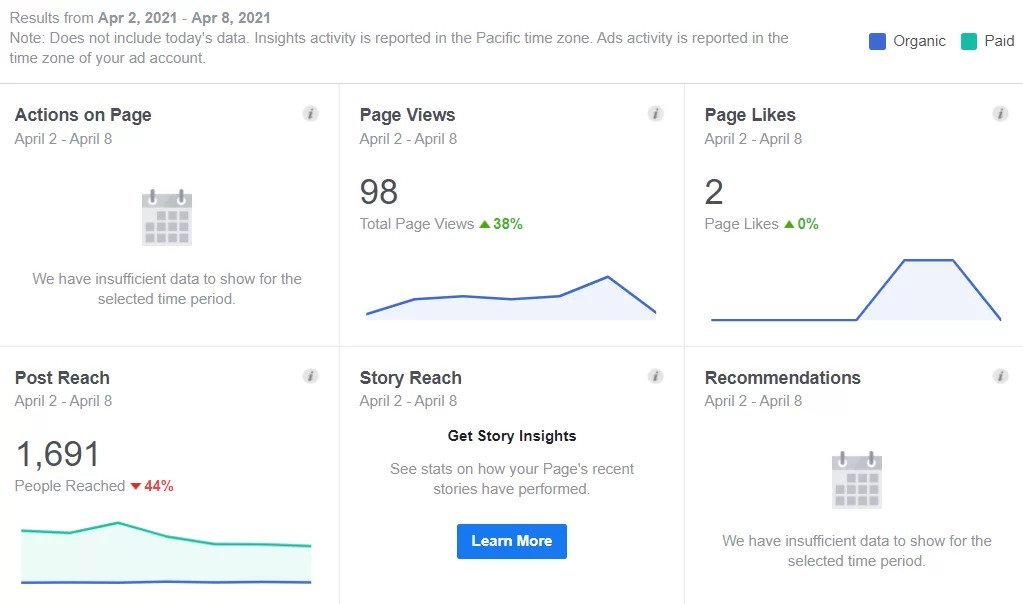
Image credit: advertisemint.com
Engagement Rate
The term engagement relates to activity made by a user on either your page or your posts, which includes liking your page, liking your posts, reacting to your posts, commenting on your posts or even sharing your posts. It also refers to an activity where the user has clicked on the link within a post.
Engagement is a great measure of how well your content resonates with your audience. It also helps you determine the posts and content that generate the most engagement. Know this, and you’ll likely post similar content to increase engagement and followership.
With enhanced engagement, the channel will also feature your content in more users’ newsfeeds. “Well, that content is getting a lot of attention”, they say, and so they think they’ll add it to more people’s newsfeeds as it’s clearly of interest to many.
Getting seen by more people outside your current community is a great way to increase your followership on Facebook too.
Where can I find the engagement rate?
In Facebook Insights, the metrics can be found in the Content tab. And in Creator Studio, overall engagement numbers are found in the Insights tab, while post-level ones are in the Published tab.

Image credit: neilpatel.com
An engagement rate is calculated by taking the total number of engagements and dividing them by the total reach number, and converting it into a percentage.
Impression Rate
An impression refers to how many times a post appears in someone’s timeline. If someone sees your post more than once, that’s called a repeat impression. The impression rate allows you to understand your post’s overall visibility.

Image credit: oviond.com
Reach Rate
Reach refers to the potential number of users who have seen your Facebook post. This number includes organic posts as well as those that are paid social i.e. Facebook advertisements or boosted posts.
It’s important not to confuse this rate with impressions, which is the number of times a post is published on a news feed. If for example, a post received 10 impressions, but one reach, then that one person has viewed your post 10 times and is likely to be very engaged with its content.
Where can I find the reach rate?
The Facebook Page Report provides an average daily reach per page, which is automatically calculated. Additionally, the Post Performance Report provides both average reach and average potential reach per post as a part of Premium Analytics.

Image credit: sproutsocial.com
If you’re working within Facebook’s Creator Studio, you’ll find Reach Rate on the Insights and Published tab.
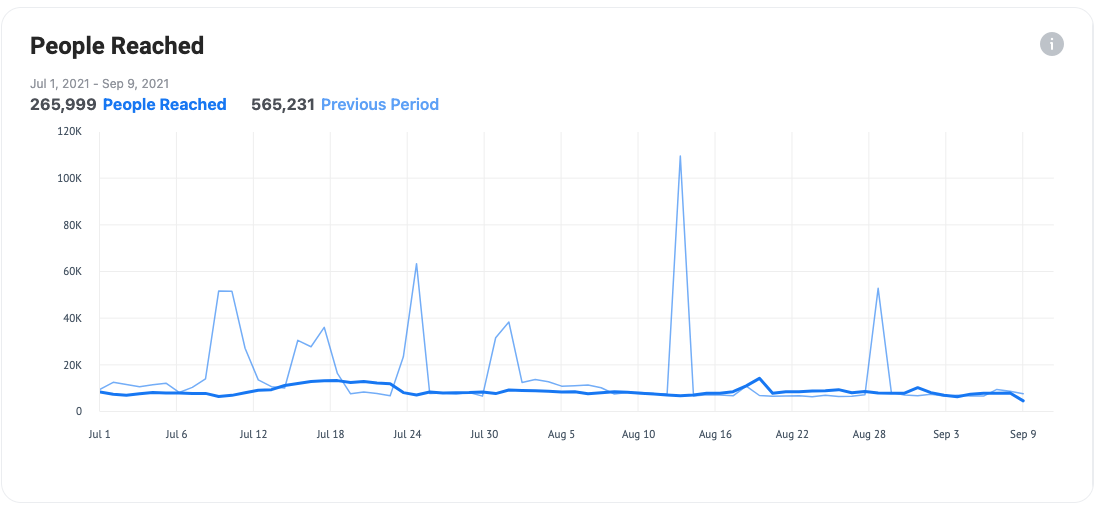
Image credit: agorapulse.com
So here we have a whistle-stop tour of the key metrics to measure the success and performance of your actual Facebook page and the content you post.
Like what you’ve read?
Jo Buchanan, the author of this blog, is the Founder and Director of TwitTwooYou Limited, a business growth strategic consultancy centred on getting brands noticed. TwitTwooYou offers smart services to help businesses grow and achieve their aspirations and goals. Want to get your brand noticed? Get in touch for a free, no-obligation chat.